A new idea to
obtain clean fusion energy
Home Introduction Calculations Videos Facebook Contact Sitemap
11.5 Confinement of positive ions and electrons with a static electric and magnetic field
 Visualizing
the electric field and some experiments
Visualizing
the electric field and some experiments
|
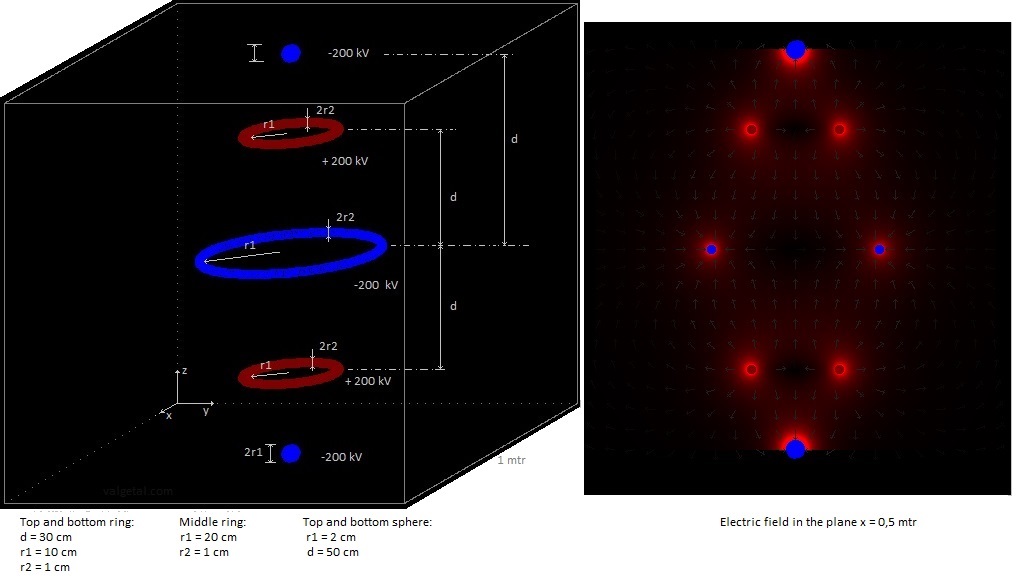
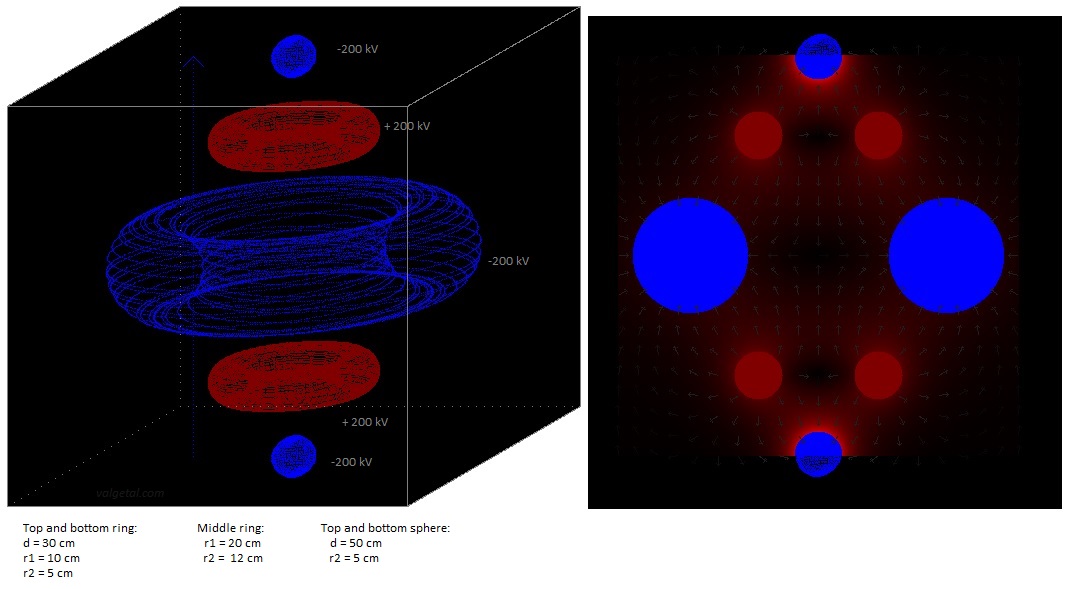
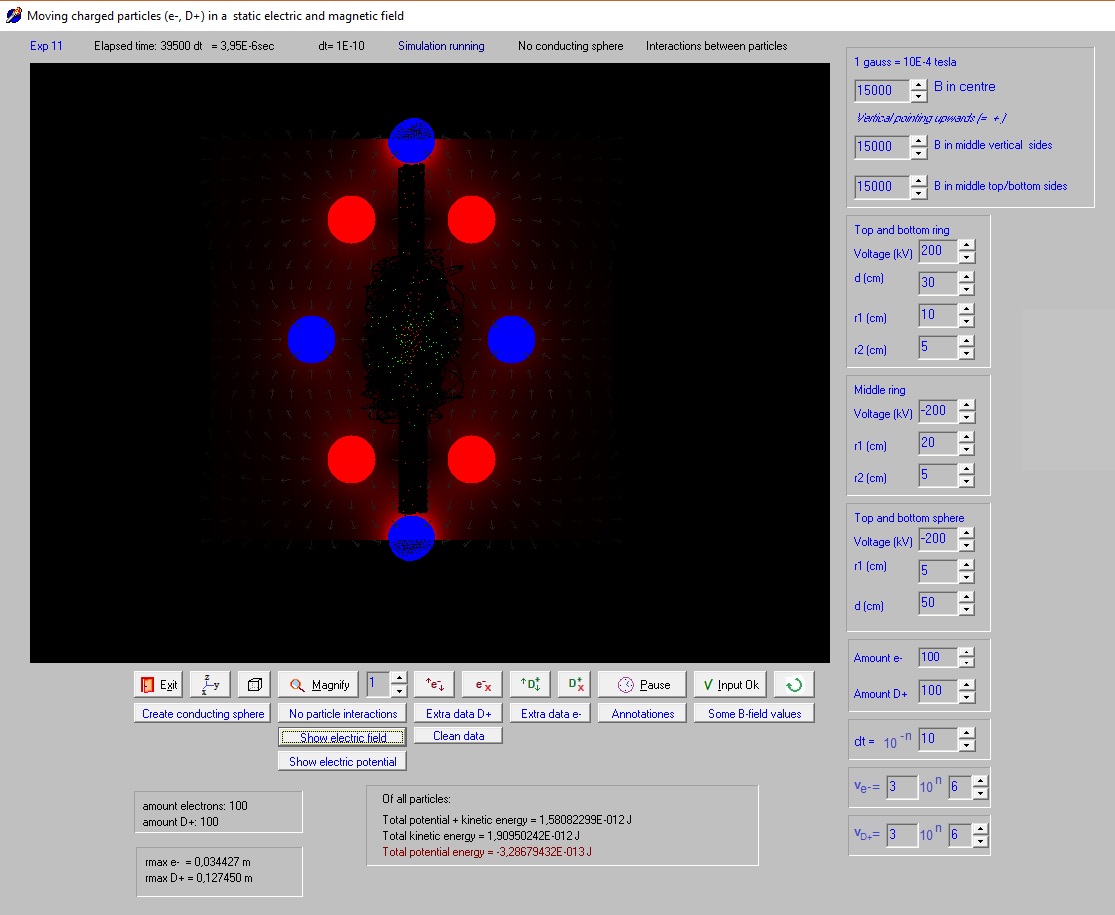
In the simulation
program we can now visualize the electric
field in the plane x= 0,5 mtr; see the images below.
The direction of the electric field is indicated by the
arrows (this corresponds to the direction of the force a positive particle
would experience). Fig. 1
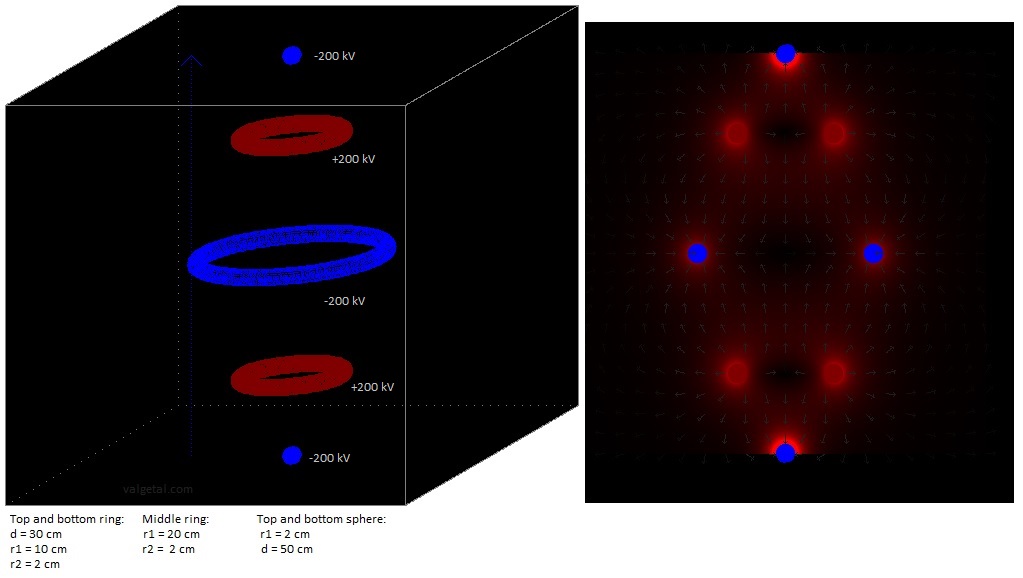
Fig. 2
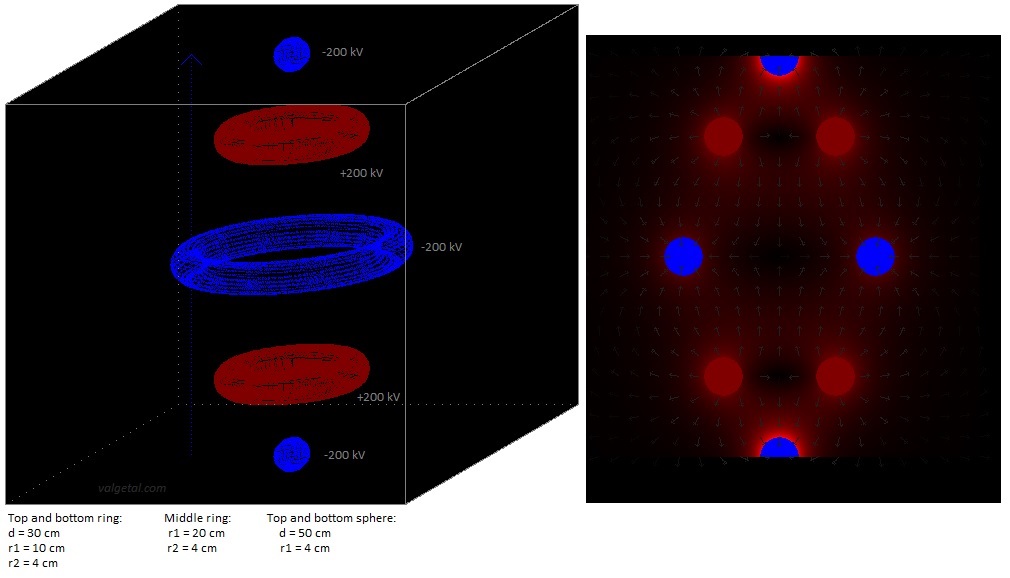
Fig. 3.
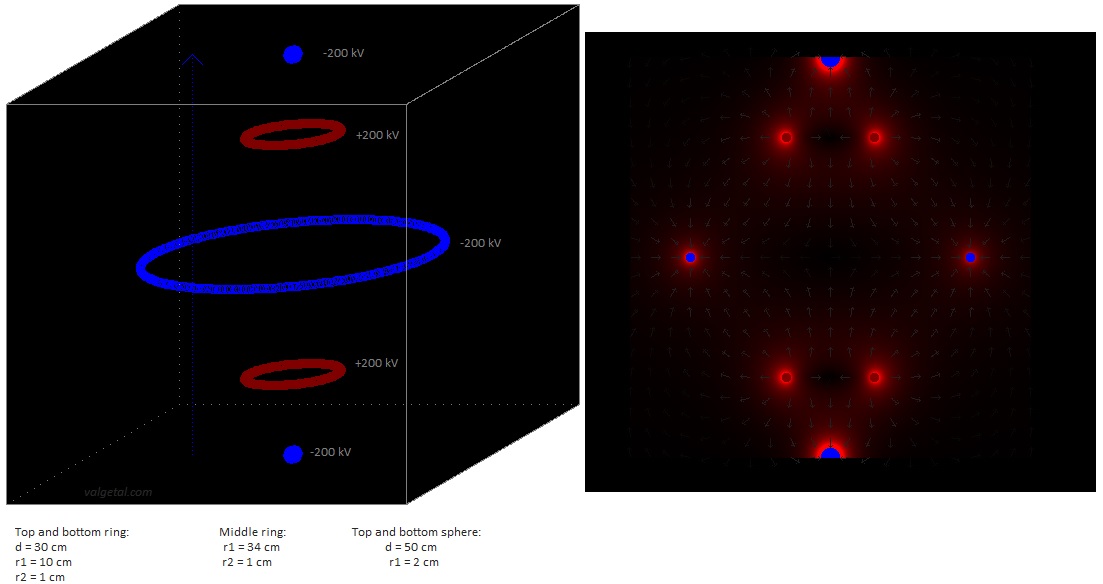
Fig. 4.
Fig. 5.
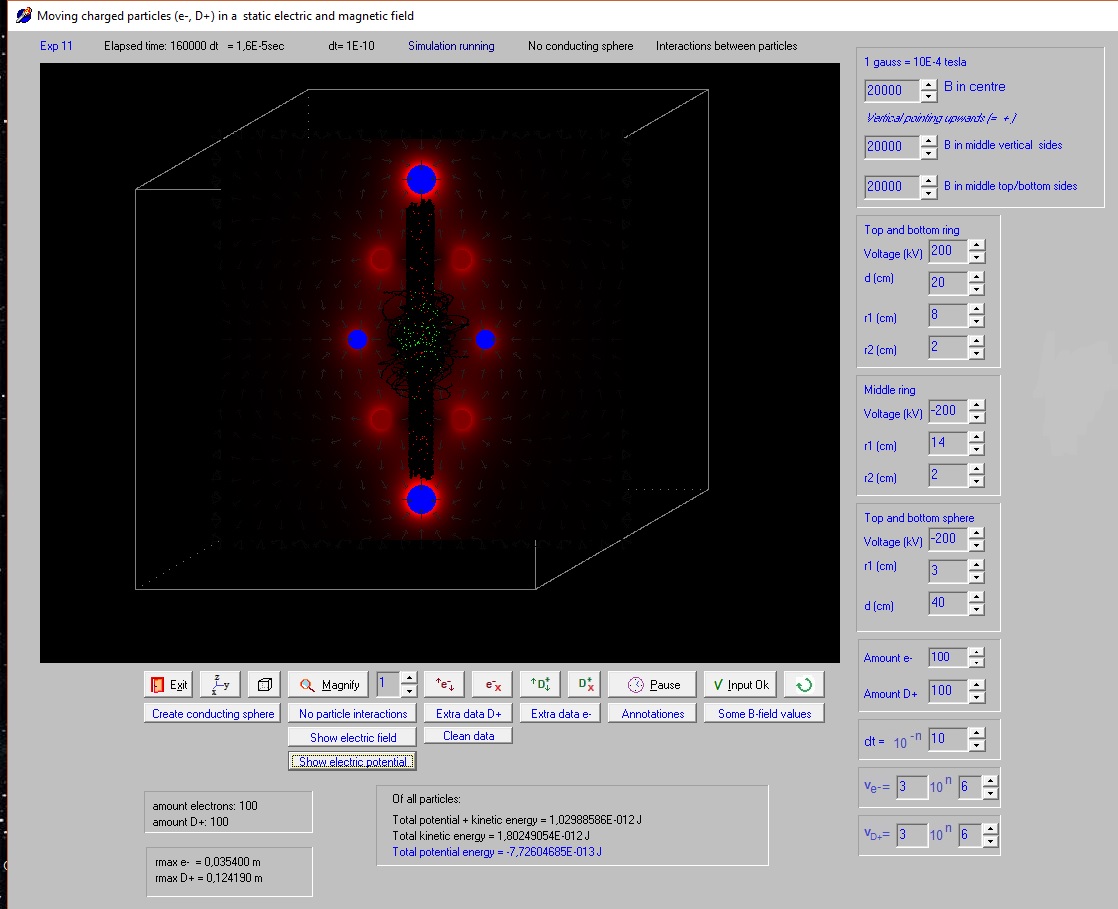
Fig. 6a. Experiment with B = 2 T and the smallest possible size & fig.6b Potential (red = +, blue = - )
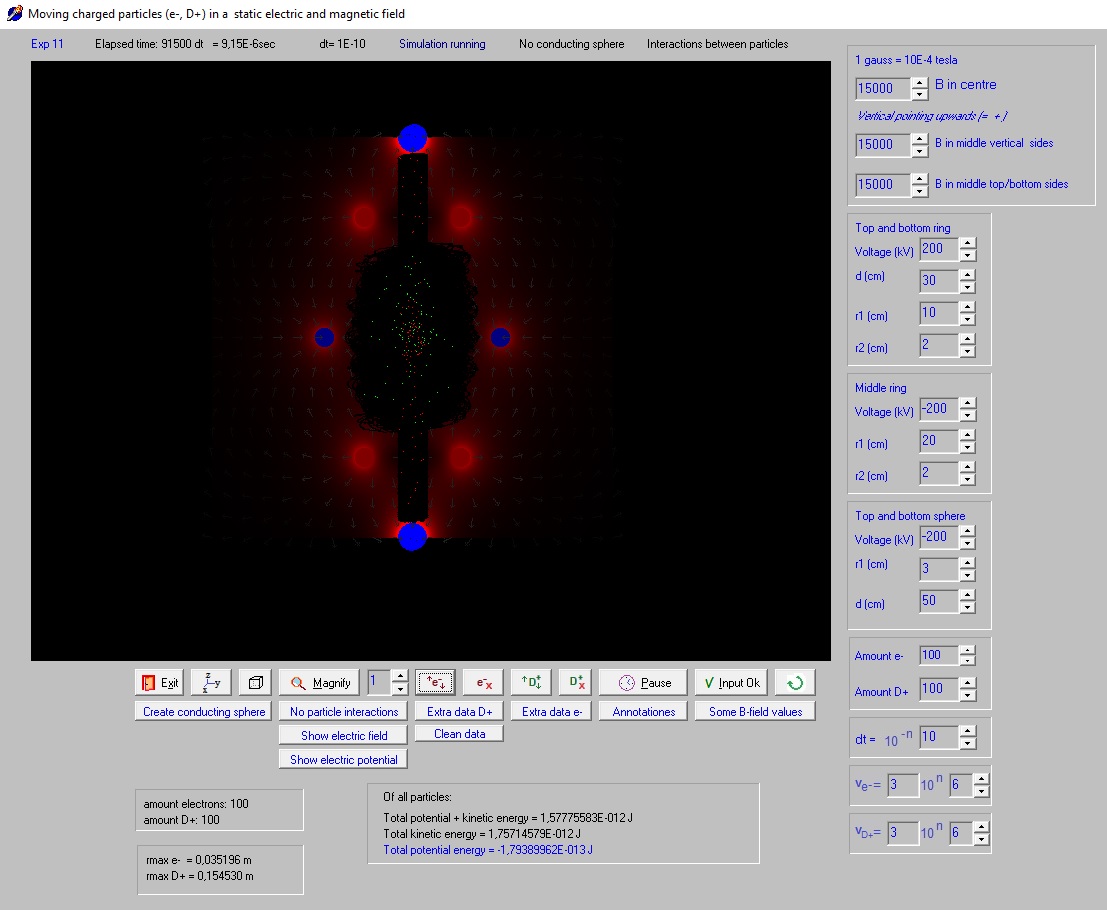
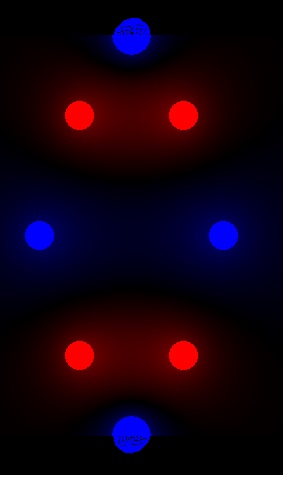
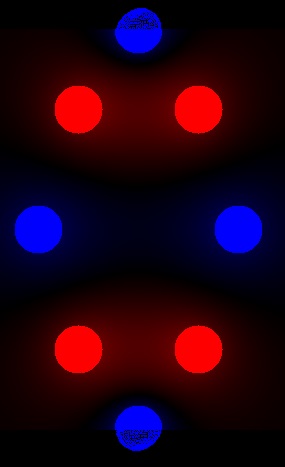
Fig. 7. Experiment with B = 1.5 T & fig.7b Potential (red = +, blue = - )
Fig. 8a.. Experiment with B = 1.5 T & & fig.8b. Potential (red = +, blue = - )
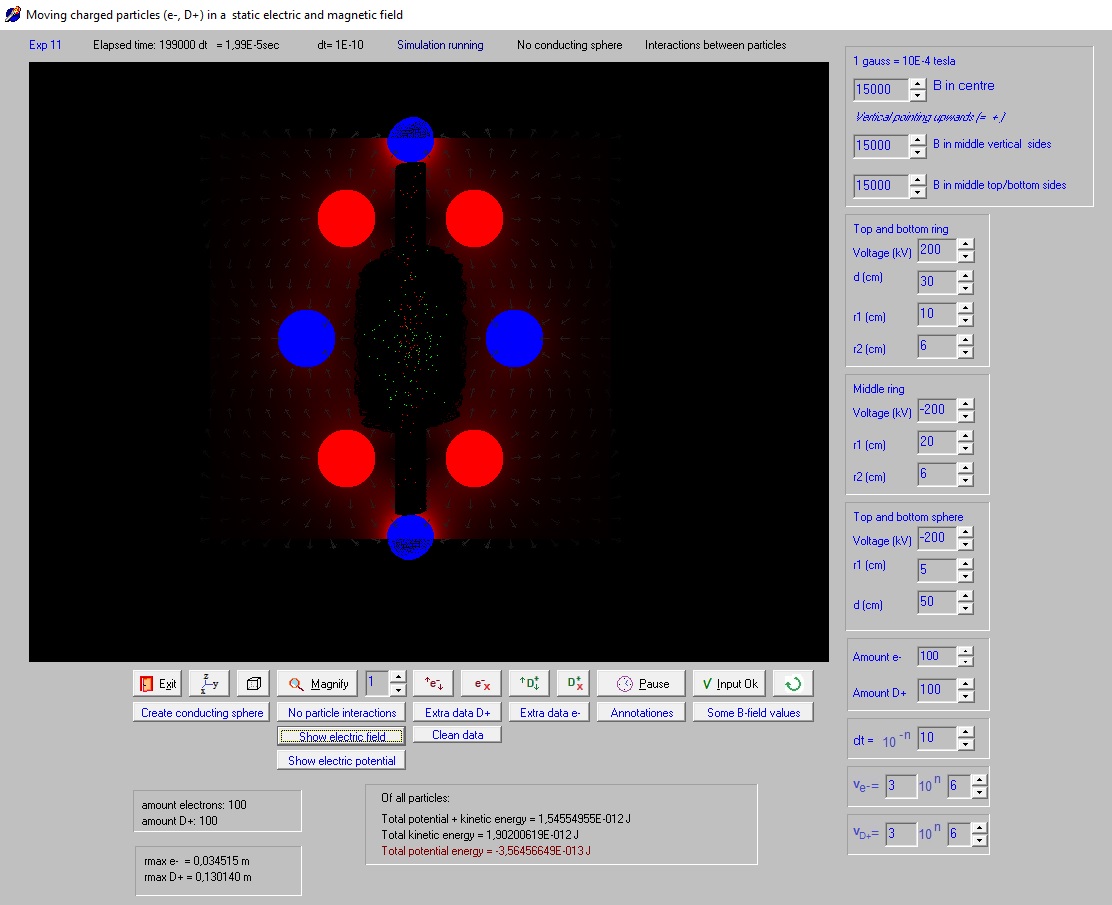
The rings have a greater diameter. With the same voltage, they produce a
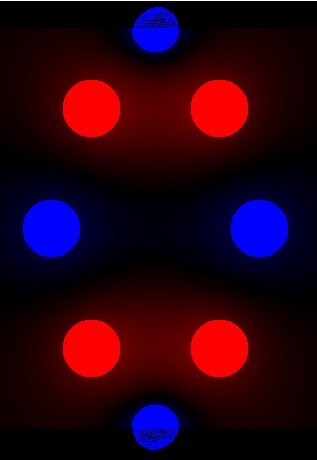
stronger electric field Fig. 9a. Experiment with B = 1.5 T & fig.9b Potential (red = +, blue = - )
Fig. 10a. Experiment with B = 1.5 T & fig.10b Potential (red = +, blue = - )
|
|
|